Retail Banking Jobs

Retail Banking
UK

The table below looks at the prevalence of the term Retail Banking in permanent job vacancies. Included is a benchmarking guide to the salaries offered in vacancies that cited Retail Banking over the 6 months leading up to 23 January 2025, comparing them to the same period in the previous two years.

6 months to
23 Jan 2025
Same period 2024 Same period 2023
Rank 632 635 632
Rank change year-on-year +3 -3 +195
Permanent jobs citing Retail Banking 137 131 419
As % of all permanent jobs advertised in the UK 0.21% 0.20% 0.39%
As % of the General category 0.32% 0.32% 0.57%
Number of salaries quoted 46 105 232
10th Percentile £56,250 £57,988 £35,700
25th Percentile £72,500 £61,250 £56,250
Median annual salary (50th Percentile) £86,650 £79,632 £70,735
Median % change year-on-year +8.81% +12.58% +8.82%
75th Percentile £122,500 £91,934 £89,852
90th Percentile £125,000 £113,000 £105,000
UK excluding London median annual salary £85,800 £70,576 £60,000
% change year-on-year +21.57% +17.63% +50.94%

All General Skills
UK

Retail Banking falls under the General Skills category. For comparison with the information above, the following table provides summary statistics for all permanent job vacancies requiring common skills.

Permanent vacancies with a requirement for common skills 42,496 41,176 74,002
As % of all permanent jobs advertised in the UK 65.06% 61.68% 68.96%
Number of salaries quoted 17,360 29,159 42,716
10th Percentile £33,750 £28,000 £32,500
25th Percentile £45,000 £39,085 £45,000
Median annual salary (50th Percentile) £60,000 £55,000 £62,400
Median % change year-on-year +9.09% -11.86% +4.00%
75th Percentile £80,000 £77,500 £83,750
90th Percentile £101,250 £96,539 £101,250
UK excluding London median annual salary £52,500 £50,000 £52,500
% change year-on-year +5.00% -4.76% +5.00%

Retail Banking
Job Vacancy Trend

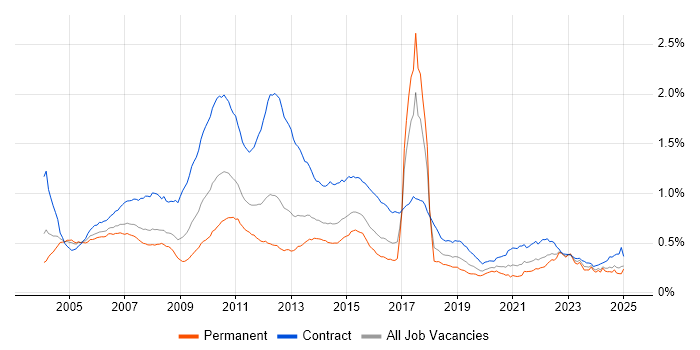
Job postings citing Retail Banking as a proportion of all IT jobs advertised.

Job vacancy trend for Retail Banking in the UK

Retail Banking
Salary Trend

3-month moving average salary quoted in jobs citing Retail Banking.

Salary trend for Retail Banking in the UK

Retail Banking
Salary Histogram

Salary distribution for jobs citing Retail Banking over the 6 months to 23 January 2025.

Salary histogram for Retail Banking in the UK

Retail Banking
Top 15 Job Locations

The table below looks at the demand and provides a guide to the median salaries quoted in IT jobs citing Retail Banking within the UK over the 6 months to 23 January 2025. The 'Rank Change' column provides an indication of the change in demand within each location based on the same 6 month period last year.

Location Rank Change
on Same Period
Last Year
Matching
Permanent
IT Job Ads
Median Salary
Past 6 Months
Median Salary
% Change
on Same Period
Last Year
Live
Jobs
England +41 124 £85,000 +6.74% 51
London +73 99 £87,500 - 36
UK excluding London -38 38 £85,800 +21.57% 16
Work from Home -7 17 £94,637 +34.09% 12
Scotland +21 13 £125,000 +56.61% 2
North of England +3 9 £94,637 +18.84% 5
Midlands -2 7 £81,250 +36.43% 6
North West -24 6 £94,637 +30.55% 4
South East 0 4 £85,400 - 3
West Midlands -17 4 £65,000 +9.14% 2
South West +23 3 £95,000 +26.49%
Yorkshire +21 2 - - 1
East of England -27 2 £70,000 +12.00%
East Midlands - 2 £77,500 - 4
North East - 1 - -

Retail Banking
Co-occurring Skills and Capabilities by Category

The follow tables expand on the table above by listing co-occurrences grouped by category. The same employment type, locality and period is covered with up to 20 co-occurrences shown in each of the following categories:

Application Platforms
1 15 (10.95%) SAS
2 14 (10.22%) Mule
Applications
1 1 (0.73%) Microsoft Excel
Business Applications
1 1 (0.73%) Avolution ABACUS
Cloud Services
1 53 (38.69%) AWS
2 51 (37.23%) Azure
3 33 (24.09%) GCP
4 9 (6.57%) GitHub
5 8 (5.84%) Power Platform
6 7 (5.11%) Cloud Computing
6 7 (5.11%) Snowflake
7 5 (3.65%) Datadog
8 4 (2.92%) Amazon EC2
8 4 (2.92%) Amazon EKS
8 4 (2.92%) Amazon ElastiCache
8 4 (2.92%) Amazon S3
8 4 (2.92%) Azure DevOps
8 4 (2.92%) Azure Event Grid
8 4 (2.92%) Azure Logic Apps
8 4 (2.92%) Azure Monitor
8 4 (2.92%) CloudFront
8 4 (2.92%) Route 53
9 1 (0.73%) OpenShift
9 1 (0.73%) Serverless
Communications & Networking
1 1 (0.73%) Firewall
1 1 (0.73%) LAN
1 1 (0.73%) Network Security
1 1 (0.73%) SD-WAN
1 1 (0.73%) Software-Defined Networking
1 1 (0.73%) Unified Communications
1 1 (0.73%) VoIP
1 1 (0.73%) WAN
1 1 (0.73%) Wi-Fi
Database & Business Intelligence
1 15 (10.95%) Data Lake
1 15 (10.95%) Metadata
2 8 (5.84%) Data Warehouse
2 8 (5.84%) PostgreSQL
2 8 (5.84%) Power BI
3 6 (4.38%) MongoDB
3 6 (4.38%) NoSQL
4 4 (2.92%) Amazon Aurora
4 4 (2.92%) DocumentDB
4 4 (2.92%) Redis
4 4 (2.92%) SQL Server
5 2 (1.46%) Big Data
6 1 (0.73%) Apache Hive
6 1 (0.73%) DB2
6 1 (0.73%) Hadoop
Development Applications
1 17 (12.41%) GitLab
2 14 (10.22%) Git
3 11 (8.03%) Jenkins
4 10 (7.30%) CircleCI
4 10 (7.30%) JUnit
5 8 (5.84%) Xcode
5 8 (5.84%) XCTest
6 1 (0.73%) Cucumber
General
1 98 (71.53%) Finance
2 90 (65.69%) Banking
3 42 (30.66%) Social Skills
4 36 (26.28%) Inclusion and Diversity
5 30 (21.90%) Analytical Skills
6 15 (10.95%) Financial Institution
7 14 (10.22%) Legal
8 9 (6.57%) Presentation Skills
8 9 (6.57%) Public Speaking
9 7 (5.11%) Retail
10 6 (4.38%) Investment Banking
10 6 (4.38%) Social Science
11 3 (2.19%) Automotive
12 2 (1.46%) Spanish Language
12 2 (1.46%) Tech for Good
13 1 (0.73%) Corporate Banking
13 1 (0.73%) Local Government
13 1 (0.73%) Manufacturing
13 1 (0.73%) Marketing
Job Titles
1 40 (29.20%) Lead
2 36 (26.28%) Senior
3 26 (18.98%) Developer
4 25 (18.25%) Architect
5 15 (10.95%) Data Architect
6 14 (10.22%) Analyst
6 14 (10.22%) Fraud Analyst
6 14 (10.22%) Senior Analyst
6 14 (10.22%) Senior Strategy Analyst
6 14 (10.22%) Strategy Analyst
7 11 (8.03%) Senior Developer
8 10 (7.30%) Android Developer
9 9 (6.57%) Risk Manager
9 9 (6.57%) Solutions Architect
10 8 (5.84%) iOS Developer
11 7 (5.11%) Senior Architect
11 7 (5.11%) Senior Solutions Architect
12 6 (4.38%) Audit Manager
12 6 (4.38%) Full-Stack Engineer
12 6 (4.38%) Java Engineer
Libraries, Frameworks & Software Standards
1 28 (20.44%) RESTful
2 15 (10.95%) Kafka
3 10 (7.30%) Android SDK
3 10 (7.30%) AngularJS
3 10 (7.30%) React
4 9 (6.57%) GraphQL
5 8 (5.84%) iOS SDK
6 7 (5.11%) Spring Boot
7 5 (3.65%) .NET
8 4 (2.92%) ARM Templates
8 4 (2.92%) YAML
9 3 (2.19%) PyTorch
9 3 (2.19%) TensorFlow
10 2 (1.46%) Ruby on Rails
11 1 (0.73%) Android Jetpack
11 1 (0.73%) HTML
11 1 (0.73%) OAuth
11 1 (0.73%) REST
11 1 (0.73%) Spring
Miscellaneous
1 19 (13.87%) Cloud Native
2 14 (10.22%) Onboarding
3 13 (9.49%) Public Cloud
4 10 (7.30%) CMDB
4 10 (7.30%) Mobile App
5 9 (6.57%) Greenfield Project
6 4 (2.92%) Derivative
6 4 (2.92%) Distributed Applications
6 4 (2.92%) Legacy Systems
7 3 (2.19%) Algorithms
8 1 (0.73%) Credit Risk
8 1 (0.73%) Data Centre
8 1 (0.73%) Distributed Systems
8 1 (0.73%) Enterprise Cloud
8 1 (0.73%) Management Information System
Operating Systems
1 12 (8.76%) Android
2 9 (6.57%) Apple iOS
3 5 (3.65%) Windows
4 2 (1.46%) CoreOS
4 2 (1.46%) Linux
4 2 (1.46%) Unix
4 2 (1.46%) zOS
Processes & Methodologies
1 57 (41.61%) Agile
2 37 (27.01%) CI/CD
3 36 (26.28%) Asset Management
4 33 (24.09%) Problem-Solving
5 32 (23.36%) Business Development
6 30 (21.90%) Microservices
7 28 (20.44%) Mentoring
8 26 (18.98%) Data Modelling
8 26 (18.98%) Migration
9 25 (18.25%) Coaching
10 24 (17.52%) Analytics
10 24 (17.52%) Innovative Thinking
11 23 (16.79%) Regulatory Change
12 21 (15.33%) Data Management
13 19 (13.87%) DevOps
13 19 (13.87%) Test Automation
14 18 (13.14%) MVVM
15 16 (11.68%) Cost Management
15 16 (11.68%) Data Migration
15 16 (11.68%) TDD
Programming Languages
1 32 (23.36%) Java
2 24 (17.52%) SQL
3 20 (14.60%) Python
4 11 (8.03%) Kotlin
5 9 (6.57%) C#
6 8 (5.84%) Objective-C
6 8 (5.84%) Swift
7 6 (4.38%) PowerShell
7 6 (4.38%) Scala
8 4 (2.92%) Bicep
8 4 (2.92%) Kusto Query Language
9 2 (1.46%) JavaScript
9 2 (1.46%) Ruby
Qualifications
1 19 (13.87%) AWS Certification
2 15 (10.95%) Azure Certification
3 7 (5.11%) Degree
4 4 (2.92%) AWS Certified Solutions Architect
Quality Assurance & Compliance
1 6 (4.38%) QA
2 3 (2.19%) ITGC
3 1 (0.73%) Data Quality
System Software
1 8 (5.84%) Docker
2 4 (2.92%) Virtual Desktop
3 3 (2.19%) Active Directory
Systems Management
1 9 (6.57%) Kubernetes
2 7 (5.11%) Terraform
3 5 (3.65%) Grafana
3 5 (3.65%) Prometheus
4 4 (2.92%) Packer
5 3 (2.19%) Active Directory Federation Services
6 2 (1.46%) Ansible
6 2 (1.46%) CA Endevor
6 2 (1.46%) Microsoft Intune
6 2 (1.46%) Progress Chef
6 2 (1.46%) Puppet
7 1 (0.73%) FortiGate
Vendors
1 18 (13.14%) Brio
1 18 (13.14%) Microsoft
2 10 (7.30%) ServiceNow
3 8 (5.84%) Apple
4 7 (5.11%) Databricks
5 5 (3.65%) Adobe
5 5 (3.65%) Google
6 2 (1.46%) Teradata
7 1 (0.73%) Aruba
7 1 (0.73%) BiZZdesign
7 1 (0.73%) Cisco
7 1 (0.73%) Mitel
7 1 (0.73%) Oracle
7 1 (0.73%) Red Hat
7 1 (0.73%) Salesforce
7 1 (0.73%) Sparx